


JOURNAL TRANSLATION
Journal: Asian-Australasian Journal of Animal Sciences Vol. 32, No. 4: 467-476 April 2019
By: Muhammad Tegar K.K., S.Pt
INTRODUCTION
Background
Indonesia has many local cattle breeds such as Bali cattle, coastal cattle, Sumba ongole, Madura aceh grati, kaingan, Sumbawa, pasudan, jabbress, and Galekan, each with its own characteristics. These cattle breeds play a vital role in Indonesia, particularly in the socio-economic, conservation, and breeding programs. Therefore, there is a need for breeding programs based on the specific potential of each breed and its genetic information. The lack of recording in Indonesia has resulted in the ineffectiveness of programs aimed at conservation and breeding.
Information about genetic diversity is needed for conservation programs, especially for Indonesian local cattle breeds, so that local farmers can utilize them to develop livestock businesses. DNA technology advancements have made it possible to support such programs. Microsatellites are ideal parts of DNA for analysis because they are abundant, highly polymorphic, and widely distributed throughout the euchromatic regions of the genome. Microsatellites can be used to estimate genetic distance, relationships between breeds, parental tests, and genetic diversity.
Objective
This research was conducted to assess the genetic diversity of cattle in Indonesia using microsatellites and to group cattle breeds based on genetic distance in order to provide information that supports the development of local cattle breeding in Indonesia.
MATERIALS AND METHODS
Materials
This study used blood samples from cattle in Indonesia, including Purebred Simmental (n=19), Simmental Crossbred (n=27), Ongole Grade (n=27), Bali (n=20), Coastal (n=13), Holstein Friesian (n=20), Sumba Ongole (n=38), Madura (n=20), Banteng (n=20), and Pasundan cattle (n=25). Blood samples were collected in amounts of 3-5 ml. Blood collection was done using Venoject.
Primer and Amplification
Twelve microsatellite primers with high PIC values recommended by FAO were used in the PCR method. The PCR reaction contained KAPA2G Robust Hot Start Ready Mix PCR Kit (Kapa Biosystems, Cape Town, South Africa) (18 µL), forward and reverse labeled primers (200 ng/µL), nuclease-free water, and DNA samples. The analysis was conducted at the BASE Laboratory, Malaysia.
Data Analysis
Allele size data was converted using the CONVERT application version 1.3.1 to facilitate data analysis. The converted data was analyzed using POPGEN version 1.3.2 to observe observed heterozygosity, expected heterozygosity, genetic differences, Hardy-Weinberg equilibrium, and allele frequencies. Genetic distances were calculated using MEGA application version 6.0.
Results
Genetic diversity can be measured by looking at the number of alleles. Below is a table showing the number of alleles in this study:
Table 1, Statistics of Allele Number, Mean Effective Alleles, Observations, Heterozygosity, and PIC values
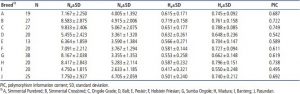
Table 2. Fixation index values
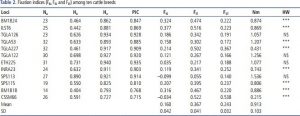
Table 3. Genetic distance in 10 breeds based on Nei identity (below diagonal) and Genetic Distance (above diagonal)
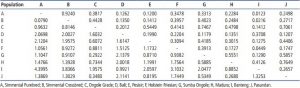
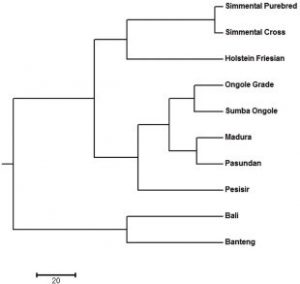
Figure 1. Dendrogram of Cattle Breeds in Indonesia using UPGMA
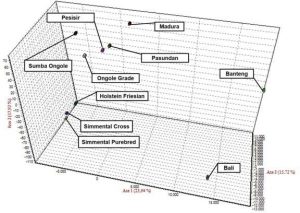
Figure 2. Correspondence Factor Analysis (CFA) of Cattle Breeds in Indonesia
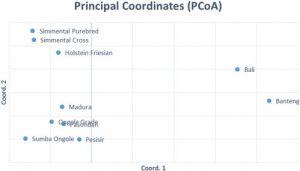
Figure 3. PCoA of Cattle Breeds in Indonesia
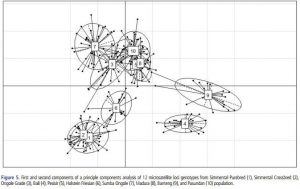
Figure 4. PCoA of Cattle Breeds in Indonesia
Discussion
The use of microsatellites to evaluate genetic diversity in Indonesian cattle has been reported to provide phylogenetic relationships between breeds. However, using microsatellites as a basis to assess genetic diversity in Indonesian cattle is being done for the first time in this study. This research used 12 out of 30 microsatellite markers recommended by FAO. Expected heterozygosity values were higher than observed heterozygosity values in all populations. This could be due to mating control, Wahlund effect, inbreeding, and a combination of these factors. In other words, low heterozygosity values indicate that these breeds have been well conserved.
PIC values above 0.5 indicate usable locus information and valid information. In other words, this information can be used as a basis for breeding and conservation programs. Fixation index values indicate indications of selection processes in the population.
Previous research showed significant differences in morphological characteristics between purebred Simmental and Simmental crossbreeds. This study supports that, as crossbred Simmental and purebred Simmental have different genetics based on microsatellite analysis. The same applies to Sumba Ongole and Ongole, where microsatellite differences indicate genetic divergence between the two breeds.
Genetic distance based on PCA can illustrate relative effects on intra-inter-species diversity. PCA analysis indicates close relationships between crossbred Simmental and purebred Simmental. Madura, Pasundan, and Coastal breeds also have close kinship. Genetic distance values can be influenced by various factors, including the population used in the analysis. There are many similarities between Banteng and cattle.
In this study, Bali cattle indeed match the fact that Bali cattle are domesticated Banteng. CFA, PCoA, and PCA values show that Banteng and Bali cattle have a close genetic affinity. Meanwhile, Bali cattle, Madura, and Coastal differ from Sahiwal, Shindig, and Nallore. The Indonesian Ministry of Agriculture designates the Pasundan, Coastal, and Madura breeds as indigenous Indonesian breeds.
Conclusion
The 12 microsatellites in this study demonstrate high levels of polymorphism and valuable information for determining genetic diversity in Indonesian cattle breeds. All identifications point to categorizing cattle breeds into three clusters: Bos Taurus cluster (Purebred Simmental, crossbred Simmental, and FH), Bos Indicus cluster (Sumba Ongole, Ongole, Madura, Pasundan, and Coastal), and Bos Javanicus cluster (Banteng and Bali cattle).